
Understanding and improving Tribal governments’ and non-entitlement units of local governments’ experience With the State and Local Fiscal Recovery Funds program

What priority outcome did we evaluate?
As part of the American Rescue Plan Act of 2021 (ARP), the U.S. Department of the Treasury (Treasury) is administering the State and Local Fiscal Recovery Funds (SLFRF) program, which provides $350 billion in funding for eligible state, local, territorial, and Tribal governments (recipients) to support their response to and recovery from the COVID-19 public health emergency. More than 500 Tribal governments¹ (Tribes) and approximately 27,000 small cities and towns – referred to as non-entitlement units of local government (NEUs)² and comprising nearly 40% of the total U.S. population – were respectively allocated $20 billion and $19.5 billion of this funding.³ The Office of Evaluation Sciences (OES) and Treasury collaborated to understand Tribes’ and NEUs’ experience using and reporting on their SLFRF funds. OES conferred with members of Tribal nations and engaged Treasury’s Tribal liaison team for input and feedback throughout the study.
What was the challenge?
The size and scope of SLFRF makes it an unprecedented opportunity for Tribes and NEUs to address immediate and long-term recovery needs in their communities. SLFRF can also present a challenge to implement owing to the diversity of Tribe and NEU contexts and their capacity for meeting administration and reporting requirements. For many NEUs, SLFRF is the largest one-time transfer of federal funds in nearly 40 years and, for many, was the first time they needed to report on their use of federal funds.⁴ In order to promote transparency, responsibility, and equity in the use of funds,⁵ recipients are required to submit spending reports to Treasury. Reporting requirements vary by recipient type and funding allocation. In response in part to recipients’ different administrative capacity, Treasury introduced an option for recipients to determine their revenue loss by electing a “standard allowance.” Revenue loss funds may be used to fund government services and are subject to streamlined reporting requirements.⁶
What did we do?
To study Tribes’ and NEUs’ experience with SLFRF, we needed a research design that could yield insights on their experiences with the program that went deep into the details while also providing general insights, which was complicated by the large number of, and the limited availability of data on, Tribes and NEUs. Given this context, we selected a mixed methods approach using a convergent parallel design.⁷ Through semi-structured conversations, the qualitative analysis aimed to understand Tribes’ and NEUs’ experience with, and perceptions of, the SLFRF program. The quantitative analysis complemented these conversations by developing comprehensive statistics that would support the qualitative findings.
In an effort to gain generalizable knowledge from a small set of conversations, members of Treasury’s Tribal liaison and SLFRF program team advised us on the most important recipient features to target: region, median age of the population, and administrative capacity. We then selected 17 Tribes and 12 NEUs to contact and held seven sets of semi-structured conversations with Tribe and NEU representatives (such as association leaders and regional organizations, who provided a broad overview of their members’ experiences), and individual Tribes and NEUs. Given the small sample size, qualitative results are not representative of all Tribes and NEUs.
For the quantitative analysis, we characterized the context within Tribes’ and NEUs’ communities using data from the 2015–2019 sampling frame of the American Community Survey (ACS).⁸ We compiled aggregate statistics on the factors that are likely to affect recipients’ capacity to use and report on funding, including: poverty rates, median age of the population, commute times, educational attainment, and internet connectivity. We decomposed differences across these dimensions at the regional level⁹ (for Tribes) and state level (for NEUs) to uncover differences within Tribes and NEUs geographically across the U.S.
We analyzed recipients’ submission of spending reports, which were the first set of SLFRF reports that were due for most NEUs. When Tribes and NEUs experienced difficulties accessing the systems used to report on their use of funds, they could submit requests for assistance to a “Help Desk” at Treasury, primarily via email (87% of requests) but also by direct phone call (13% of requests). We analyzed Help Desk requests submitted by recipients when they had questions about registering for, and submitting their spending reports on, Treasury’s portal. We also analyzed data on submissions of spending reports. We used these data to understand how often help requests were submitted – and resolved – by recipient type and over time, and the frequency of on-time report submission. Each statistic was disaggregated by recipient type (e.g., Tribe, NEU, or other recipient such as a county or state) to uncover whether Tribes’ and NEUs’ experiences differed from other recipient types.
What did we learn?
Qualitative Analysis
The qualitative analysis revealed that there is significant variation in Tribes’ and NEUs’ economic and social contexts. Representatives of Tribes shared that their communities are often remotely located with unreliable internet access, often have large informal economies–which were disrupted by the pandemic–and often have limited employment opportunities. They stated that they need funds to address the lack of housing, electric grid connection, and potable water. Representatives of NEUs stated that, although most are small, there are also some that are the size of small cities; thus, their sources and levels of income vary widely. Despite this variation, they shared similarities in their funding needs: water, sewer, stormwater, and drainage projects.
Figures 1 and 2 show the journey that Tribes and NEUs went through, from learning about the SLFRF program to submitting their spending reports. The figures include information about the number of times a statement was made (including by the same speaker) during the conversations, summing to a total N of 193 for Tribes and 163 for NEUs. Only statements that were made more than once are included in the figures. Throughout their journey, Tribes and NEUs relied on Treasury’s resources and staff to learn about the program, how to allocate and spend their funds, and how to submit their spending reports. At the outset of the program, both Tribe and NEU representatives were initially concerned about accepting SLFRF funds. For representatives of Tribes, this was due to mistrust of federal funding, uncertainty around the potential for audits, and perceptions that Tribes were competing with one another for funds. For representatives of NEUs, their concern derived from their inexperience with federal funding and concern about needing to repay unspent funds. The funding that Tribes and NEUs received was greatly appreciated. Both entities, however, felt that it was insufficient to cover all their needs. For some Tribes, there was uncertainty about how they should allocate their funds to maximize impact and a lack of capacity to oversee project contractors. A number of NEUs felt that the funding was insufficient to cover long-standing infrastructure needs and most delayed spending funds until the release of the Final Rule (which built on the Interim Final Rule to clarify eligible and ineligible uses of SLFRF funds) due to fear of having to repay funds in the event that the rules changed from the Interim Final Rule. Both Tribes and NEUs identified inflation and constrained supply chains as issues that prevented them from realizing some of their anticipated project aims.


Tribes and NEUs generally expressed appreciation for Treasury’s resources and responsiveness when they needed to submit spending reports on their use of funds. However, the desire for additional support early in the process was noted by a large number of NEUs, and representatives of both Tribes and NEUs experienced significant issues with registering for Treasury’s reporting portal. While the flexibility provided by the standard allowance in the Final Rule was welcome, both Tribes and NEUs expressed concern with the required frequency and extent of reporting that are required when receiving federal funding.
Quantitative Analysis
Descriptive Statistics of Tribes and NEUs
Comprehensive statistics on Tribes’ and NEUs’ context support the qualitative analysis by showing the diversity of their contexts, which can affect their perceptions of SLFRF’s reporting requirements. As Table 1 shows, the average population size for Tribes is 48,758 with a median age of 31. Tribes have a higher share of the population living in poverty (31% compared to the 2017 U.S. poverty rate of 12%) and lower rates of college attainment (11% compared to 34% nationally) and internet access (40% without versus 15% nationally). Note that all statistics for Tribes are restricted to the American Indian and Alaska Native (AIAN) population within Census-designated Tribal boundaries.
Turning to NEUs, the statistics generally mirror the U.S. population average. The average NEU population size is 27,064 although, as the interquartile range shows, the mean is driven by a relatively small share of NEUs with large populations. The median age is 40. The share living in poverty is 8% (four percentage points lower than the U.S. population) and 32% hold a Bachelor’s degree or more, which likely reflects selective out-migration from NEUs to larger metropolitan cities. Though many live in rural conditions, as on average 9% commute more than 60 minutes, only 15% lack an internet connection.
Table 1. Descriptive statistics for Tribes and NEUs
| Indicator | Tribe Mean [Q₁-Q₃] |
NEU Mean [Q₁-Q₃] |
US Mean |
|---|---|---|---|
| Population | 48,758 [3,456-86,168] |
27,064 [4,773-28,349] |
325 m |
| Median age | 31 [27-33] |
40 [36-44] |
38 |
| Pct. experiencing poverty | 31 [22-39] |
8 [3-12] |
12 |
| Pct. BA or greater | 11 [7-14] |
23 [13-30] |
34 |
| Pct. commute >=60 minutes | N/A | 9 [4-12] |
9 |
| Pct. without internet | 40 [27-55] |
15 [8-19] |
15 |
Note: The statistic for age is the mean of median age in all jurisdictions within each column.
Source: 2015–2019 sampling frame of the American Community Survey.
For Tribes and NEUs, about 80% of the variation in the variables listed in Table 1 occurs within regional and state boundaries, respectively. This result shows that Tribes and NEUs are very heterogeneous, even within their regional and state boundaries, and is relevant insofar as this diversity affects Treasury’s ability to administer the program. For example, this result might indicate that Treasury should not target resources (e.g., technical support) to Tribes/NEUs by region/state since characteristics of Tribes/NEUs are nearly as variable within the boundary as they are across the country.
Recipients’ Use of Help Desk system
The quantitative analysis of Help Desk tickets also supports the qualitative results on Tribes’ and NEUs’ experience submitting their spending reports. A clear finding is that Tribes and NEUs submitted a significant number of Help Desk requests¹⁰, reflecting the challenges they experienced when registering and submitting their spending reports. In addition, some recipients utilized the Help Desk system a disproportionate amount.
We were able to match Help Desk tickets from 69% of Tribes and 42% of NEUs. Among funding recipients that submitted Help Desk tickets, Tribes submitted more Help Desk tickets on average (mean=6; median=4), compared to the rest of the population (mean=4; median=2) and NEUs specifically (mean=3; median=2). NEUs submitted fewer Help Desk tickets, on average, than Tribes and non-NEU/non-Tribal recipients. Tribes submitted on average 3% of Help Desk tickets whereas they represent approximately 2% of the total number of SLFRF recipients and NEUs submitted on average 31% of tickets, but represent 84% of SLFRF recipients. While significant numbers of NEUs submitted Help Desk tickets, they were actually underrepresented in comparison to their overall prevalence in the SLFRF recipient population.
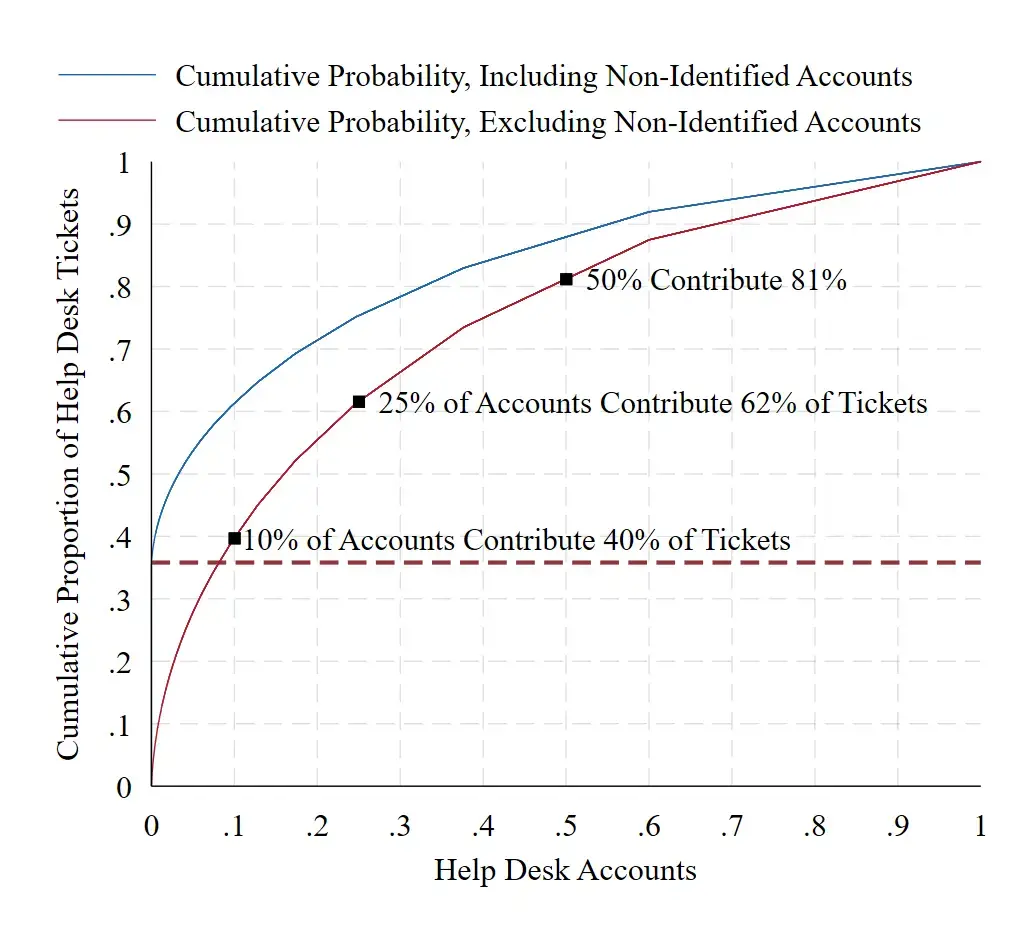
Figure 3 illustrates the prevalence of unidentified Help Desk accounts (in blue), and plots the cumulative proportion of Help Desk tickets submitted by individual recipients. As can be seen, nearly 40% of tickets are from unidentified accounts and cannot be matched. Focusing on accounts with names (in red), 10% of accounts contributed 40% of Help Desk tickets, 25% of accounts contributed 62% of Help Desk tickets, and 50% of accounts contributed 81% of Help Desk tickets, showing that a relatively small share of accounts contributed a large proportion of requests.
Figure 3. Cumulative proportion of Help Desk ticket requests
 Expand image
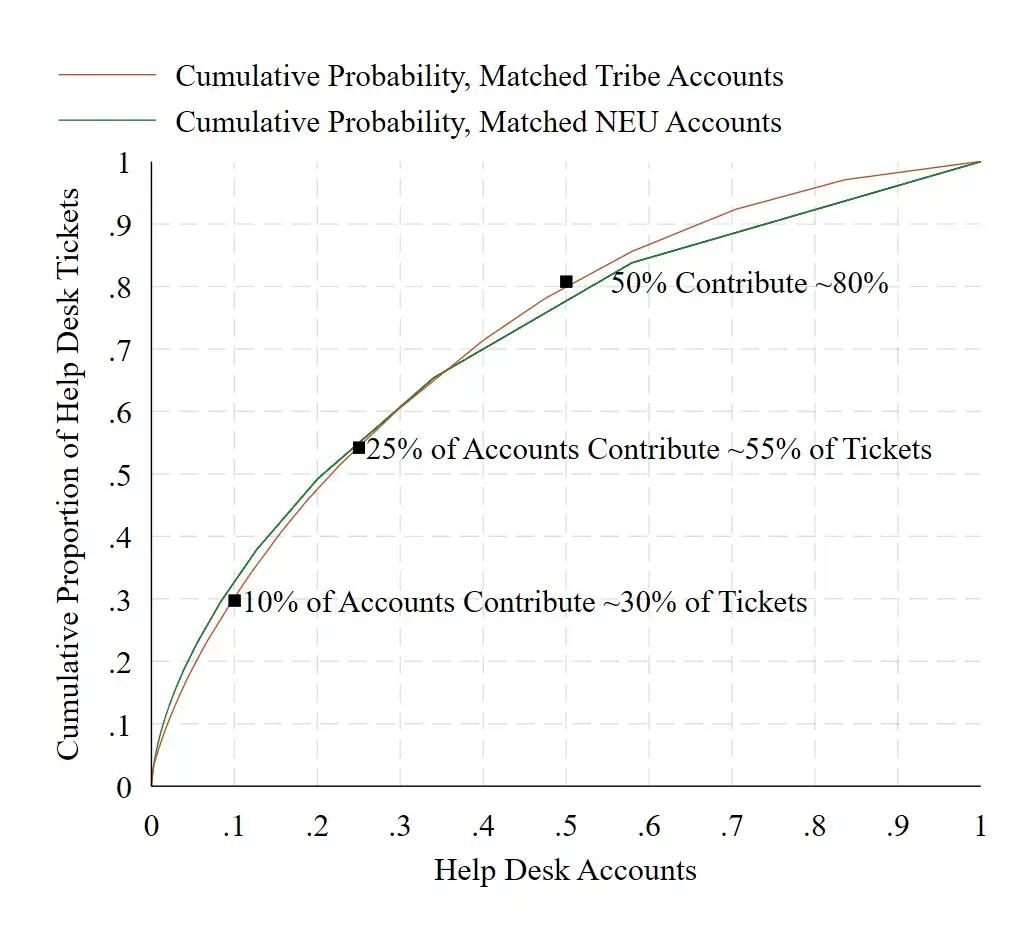
Figure 4 shows Help Desk tickets that can be matched to Tribes (orange) and NEUs (green). Compared to the entire population of Help Desk tickets with names, among the matched population of Tribe and NEUs there is less overrepresentation of select Tribes and NEUs: 10% of Tribes and NEUs contributed about 30% of Tribes’ and NEUs’ Help Desk ticket submissions compared to 10% of accounts submitting 40% of tickets across all identified accounts. In the middle and low-end of Help Desk ticket submitters, Tribes and NEUs are comparable to the total identified population: 25% of Tribe and NEU accounts contribute about 60% of tickets, which closely mirrors the full identified population, and 50% of Tribe and NEU accounts contribute about 80% of Help Desk tickets, resembling the entire identified population.
Overall, this analysis of the distribution of Help Desk tickets shows that, although there are a large number of tickets from unidentified accounts, a subset of recipients submit a large proportion of tickets. This pattern is consistent across recipient types.
NEUs with greater budgets and allocation amounts tended to request more support from Treasury. On average, within states, a 1% increase in an NEU’s budget corresponds with 0.18 additional Help Desk tickets submitted (p <0.001; 95% CI [0.16, 0.20]). Results are comparable for NEU’s allocation amount, even when looking at the association on average within states.
Figure 4. Cumulative proportion of Tribe and NEU Help Desk ticket submissions
 Expand image
Efficiency of Help Desk system in resolving recipients’ questions
The median closure time of Help Desk tickets ranged between 13-15 days for the entire recipient population, Tribes, and NEUs.¹¹ While 25% of all recipients had a closure time of three days or less, another 25% of recipients had a closure time of 30 days or more. Closure times were similar, on average, among the three types of recipients (Tribes, NEUs, and non-Tribes/NEUs).
Twenty-nine percent of Help Desk tickets can be classified as “system issues”, which include questions about how to login to the reporting platform, transfer authorization, and update contact information.¹² Twenty-two percent of Help Desk tickets submitted by Tribes relate to “system issues,” and 32% of tickets submitted by NEUs can be classified as such.
In theory, “system issue” problems may have been easier for Treasury to resolve than other challenges, but the evidence suggests this was not the case. Among all Help Desk ticket questions, the median time to close system issue problems was 17 days compared to 12 days for non-system issue problems. For Tribes, the median time to close system issue problems was 16 days compared to 15 days for non-system issues. For NEUs, the median time to close system issue problems was 17 days compared to 12 days for non-system issues.
As shown in blue in Figure 5, Help Desk submissions spiked at the April 2022 reporting deadline. Indeed, about 70% of all Tribes and NEUs that submitted Help Desk tickets did so in the 20 days leading up to the April deadline, and 60% and 70% of all Tribe and NEU Help Desk tickets, respectively, occurred within those 20 days. Despite this spike in Help Desk tickets, the time to resolve tickets increased only slightly, around this deadline, as can be seen in red in Figure 5.
Tribes and NEUs that did not submit spending reports on-time also filed more Help Desk tickets than did on-time filers. Tribes that submitted spending reports late submitted, on average, 0.4 more Help Desk tickets (p=0.456; 95% CI [-0.65,1.44]), and NEUs that submitted late submitted an additional 0.3 Help Desk requests (p<0.000; 95% CI [0.23,0.39]) on average.
Figure 5. NEU Help Desk tickets and resolution times before and after the April 2022 submission deadline</i>
 Expand image
Build evidence
Treasury and OES undertook this analysis early in the life cycle of the SLFRF program. Key findings from the study were that for many Tribes and NEUs, SLFRF was the first time that they received federal funding and there was uncertainty about the processes and potential requirements around receiving SLFRF funds. Tribe and NEU context varies widely, which created practical barriers for some Tribes’ and NEUs’ participation in the program. Both Tribes and NEUs expressed appreciation for the funding, the flexibility in how it can be used, and for the streamlined reporting requirements under the Final Rule.
Tribes and NEUs were appreciative of the wide variety of resources Treasury provided, both for allocating, and reporting on, SLFRF funding. Both types of recipients experienced notable difficulty in accessing the reporting portal, but stated that the portal and reporting process were easy to use once the technical issues were resolved. Analysis of Help Desk tickets confirms this; both Tribes and NEUs submitted a significant number of Help Desk requests for technical support from Treasury. However, Treasury was generally able to sustain Help Desk support for recipients despite large surges in demand around key deadlines.
Using these findings, OES and Treasury will work together to identify methods to further support Tribes and NEUs to most effectively use and report on their SLFRF funds.
Notes:
- As defined in section 602(g)(7) of the Social Security Act, as added by section 9901 of the American Rescue Plan Act of 2021.
- Non-entitlement units of local government (NEUs), defined in section 603(g)(5) of the Social Security Act, as added by section 9901 of the American Rescue Plan Act of 2021, are local governments typically serving populations of less than 50,000. NEUs include cities, villages, towns, townships, or other types of local governments.
- Counties also received funding under SLFRF. Since counties may include NEUs in their boundaries, NEUs may have received other funding due to funding given to overlapping jurisdictions.
- Prior to ARP, the U.S. last implemented a General Revenue Sharing (GRS) program in 1972 that expired in 1986. GRS is commonly defined as a program of federal transfers to state and local governments that does not impose specific or categorical spending requirements on the recipient government. See the Congressional Research Service report on General Revenue Sharing.
- U.S. Department of the Treasury, Coronavirus State and Local Fiscal Recovery Funds.
- Specifically, under the SLFRF Final Rule, recipients can choose a standard allowance of up to $10 million, not to exceed their award size, to compensate for their pandemic-induced revenue loss, rather than complete a full revenue loss calculation.
- Convergent parallel design consists of taking qualitative and quantitative data collection and analysis and comparing or relating the two and then interpreting them.
- For NEUs, we compiled data from the official list on Treasury’s website and then identified matching NEUs from the subset of incorporated places and county subdivisions in the ACS and COG. The list of Tribal Governments we used was taken from the list of federally-recognized American Indian reservations and Hawaiian home lands.
- The 12 regional boundaries are defined by the Department of the Interior and endorsed by the National Congress of American Indians (NCAI).
- For example, of the about 90,000 total Help Desk submissions, 2,275 are linked to Tribes, and 27,000 are linked to NEUs. Notably, about 36% or nearly 32,000 Help Desk ticket submissions do not include the name of the recipient that submitted the ticket and so cannot be matched, meaning that these estimates could be different if all Help Desk tickets could be matched to recipients.
- The mean closure time is likely a less informative statistic because there are extreme values (outliers) at the top, likely reflecting closed Help Desk tickets that were left open, despite appearing to be resolved. The median and interquartile range (IQR), which shows the distribution of closure times, are better statistics for a representative number of time to closure because they are not affected by outliers.
- Issues are classified as system issues if either the email subject or description includes terms such as “log-in”, “sign-in”, “authorized rep”, or “portal.” In addition, Treasury-coded fields that were described as either “Login” or “Contact” are included.